This section covers both the setup of the datalogger and also plotting/downloading data from the datalogger.
NOTE: You can plot data that was previously saved in the JSON format using the following link:
Introduction
The NetMeter has 2 main data logging capabilities built-in:
- Energy/Power data storage: this is enabled by default when the NetMeter is first configured. The total power demand in 1 minute intervals is stored in addition to hourly cumulative energy.
- Advanced Data Logger: can store up to 53 user selectable parameters
This section describes the Advanced Data Logger.
Setup
Setup Datalog Configuration
Requires administration privileges.
The Advanced Datalogger uses non-volatile memory to store up to 53 electrical parameters at a user-defined sample interval.
Datalogger memory is managed by the NetMeter as a FIFO (First-IN-First-Out) memory. Consequently, when the memory capacity has been reached, the oldest data will be discarded to make room for newer data. This creates a continuous, moving window into the the most recent values for the enabled parameters.
The datalog is configured using the following form:
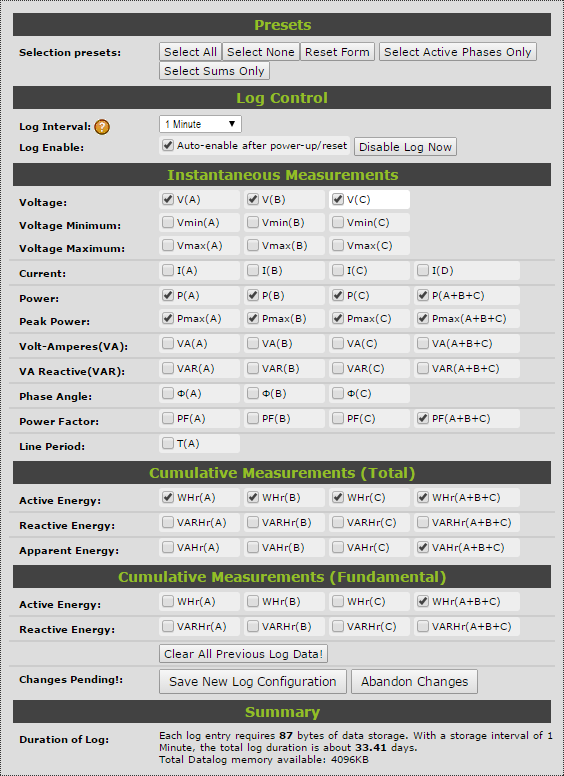
Configuration Fields
Explanation of the Setup fields:
- Presets: provides a set of predefined electrical parameters to be enabled for faster setup
- Log Interval: the sample period that data is stored into memory. A shorter interval will use memory more quickly.
- Auto-enable after power-up/reset: make sure this is checked in order for the Datalogger to start logging after a power failure or reset.
- Enable Log Now will immediately cause the NetMeter to start logging data. The page will refresh after pressing this button so make sure that any other changes to the form have been saved by pressing the Save New Log Configuration button first. Otherwise, all changes will be lost.
- Voltage - V(A), V(B), V(C): the RMS voltage of Phases A, B, and C at the instant of the sample
- Voltage Minimum - Vmin(A), Vmin(B), Vmin(C): the minimum voltage of Phases A, B, and C during the sample interval. These values are useful in detecting flicker (see IEC 61000-4-15). IEEE paper on Flicker.
- Voltage Maximum - Vmax(A), Vmax(B), Vmax(C): the maximum voltage of Phases A, B, and C during the sample interval. Also useful for detecting flicker.
- Current - I(A), I(B), I(C), I(D): the RMS current of Phases A, B, C, and the ID input at the instant of the sample
- Power - P(A), P(B), P(C), P(A+B+C): the active RMS power of Phases A, B, C, and the sum of phases A/B/C at the instant of the sample
- Power Max - Pmax(A), Pmax(B), Pmax(C), Pmax(A+B+C): the maximum values of P(A), P(B), P(C), P(A+B+C) detected over the datalog interval. Since these are RMS values, the integration period is about 1 second. Consequently, brief (1s) peak power measurment will be captured.
- Volt-Amperes(VA) - VA(A), VA(B), VA(C), VA(A+B+C): the Volt-AMP of Phases A, B, C, and the sum of the A/B/C phases at the instant of the sample
- VA Reactive(VAR) - VAR(A), VAR(B), VAR(C), VAR(A+B+C): the reactive power of Phases A, B, C, and the sum of the A/B/C phases at the instant of the sample
- Phase Angle - Φ(A), Φ(B), Φ(C): By default, this if the phase angle between voltage and current (V/I)for each of the phases. However, the advanced sensor setup provides other options: voltage-to-voltage (V/V) angle and current-to-current (I/I) angle.
- Power Factor - PF(A), PF(B), PF(C), PF(A+B+C): the ratio of active power to apparent power expressed as a percentage for each phase or for all phases combined in the case of PF(A+B+C). All the information required to calculate power factor is available through P(x)/VA(x) so it may not be necessary to capture all 3 parameters if memory capacity is a concern.
- Line Period - T(A): The period (in microseconds) of the Phase A voltage. Inverting this value gives the frequency of the Phase A voltage.
- Cumulative Measurements (Total): cumulative measurements are the ongoing summation of Active/Reactive/Apparent power and result in a Watt-Hour energy value. The "total" cumulative values are the summation of all frequency components up to 4KHz and include both the fundamental and harmonic energy.
- Active Energy - WHr(A), WHr(B), WHr(C), WHr(A+B+C): the cumulative version of P(A), P(B), P(C), P(A+B+C) in units of Watt-Hours.
- Reactive Energy - VARHr(A) VARHr(B) VARHr(C) VARHr(A+B+C): the cumulative version of VAR(A), VAR(B), VAR(C), VAR(A+B+C) in units of Watt-Hours.
- Apparent Energy - VAHr(A), VAHr(B), VAHr(C), VAHr(A+B+C): the cumulative version of VA(A), VA(B), VA(C), VA(A+B+C) in units of Volat-Amp-Hours.
- Cumulative Measurements (Fundamental): similar to the "total" measurements but contain only the energy at the fundamental frequency (50 or 60 Hz)
- Active Energy - WHr(A) WHr(B) WHr(C) WHr(A+B+C): the component of the Total active energy that is contained at the fundamental frequency. The harmonic distortion is the difference between the Total and Fundamental.
- Reactive Energy - VARHr(A) VARHr(B) VARHr(C) VARHr(A+B+C): the component of the Total reactive energy that is contained at the fundamental frequency.
What data should be enabled for logging?
This will depend on the application and the desired duration of data retention:
- Log Vmin(A), Vmin(B), Vmin(C), Vmax(A), Vmax(B), and Vmax(C) in order to detect flicker or other problems with voltage
- Log WHr(A+B+C) for total cumulative true power across all phases and also to be able to display the 15 min. running average used for peak demand calculation
- Log total WHr(A) WHr(B) WHr(C) to track the differences in power between each phase. For example: when the NetMeter is used with 3 separate single phase loads.
- Log Vmin(x), Vmax(x), PF(x), and both the Total and Fundamental versions of WHr(x), VARHr(x) in order to study power quality.
Selecting a sample interval
The sample interval will affect the total duration of the data record. While a shorter interval allows more temporal detail to be captured, it is not necessarily an advantage. Even when long sample intervals are chosen, the capture of very brief voltage dips or surges can be accomplished using the Vmin/Vmax data.
The cumulative data is summed 8000 times per second. The result, when plotted, represents an average over the interval. Consequently, it may not be necessary to use short sample intervals to acquire the necessary information.
Logging Instantaneous Power/VA/VAR Versus Cumulative Energy WHr/VAHr/VARHr
The advantage of using WHr/VAHr/VARHr is that fluctuations in power that occur between samples will be accounted for in the data. Power/VA/VAR are sampled at the instant of the sample time. As a result, fluctuations that occur in between samples will be invisible.
Logging 15 Min. Average for Peak Demand
Peak demand is typically defined as the highest average power of any 15 min. interval. The NetMeter can display the 15 minute average demand (P15(A+B+C)) from the datalogger as in the screenshot below:
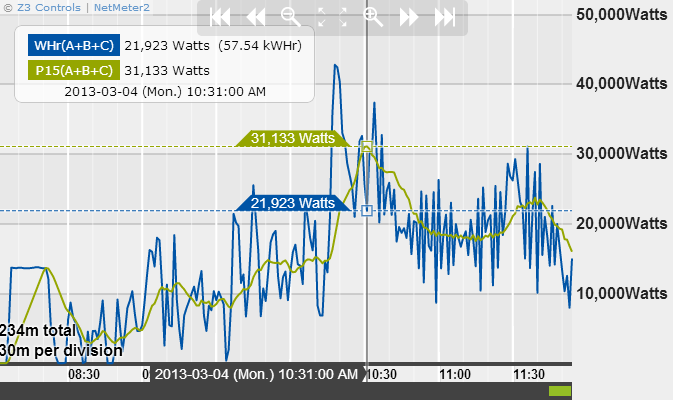
To display P15 the following setup is required:
- Enable WHr(A+B+C) in the datalog configuration
- Select a sample interval of 1min or less. A shorter sample interval will result in higher accuracy
- If P15 is not available as a display option, then you will need to upgrade your firmware.
The P15(A+B+C) is automatically derived from WHr(A+B+C) and is available for plotting in both the interactive datalog plotting utility and the datalog plotting widget. However, you must have more than 30 min. of data stored in the data logger in order for P15 to display.
Plot/Download the Data.
Use the NetMeter Datalog Archive utility to automate the retrieval of data:
- Allows data from a singe NetMeter or a list of NetMeter devices to be collected together into a single ZIP file that can be easily saved to your disk or emailed
- No need to manually download data from multiple NetMeters
- Captures both JSON and CSV formats
- Captures the format required for the Z3 controls Analytics tool
- NetMeter Datalog Archive
Datalog
The datalog plotting function is available directly from the home page in more recent software releases. Otherwise, it is available through:
SetupDatalog ConfigurationDatalog Plot
Some of the features listed in the description below may be missing from older firmware releases. Consider updating your firmware if this is the case.
Step 1: Select the Data Source
The first step to plotting data from the Datalog is to load the data. Alternately, the data may be saved to a file in either CSV format (for Excel) or JSON format (to be able to plot it later using the Z3 tool).
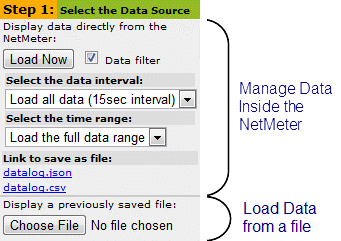
There are 2 data loading options:
- Load data directly from the NetMeter (upper section of Step 1)
- Display a previously saved data file (lower section of Step 1)
Plot Data from the NetMeter
The Load Now button allows data to be plotted directly from the Datalogger memory inside the NetMeter. However, load times may be considerable when the datalogger memory is full. The Data filter options allow a subset of the data to be loaded in order to speed up load times:
- The first filter option allows a subset of interval data to be loaded. For example: 1 out of every 4 samples.
- The second option allows a shorter range of data to be loaded. For example: today so far.
To interactively plot the data inside the NetMeter, select the desired Interval and Range and press the Load Now button.
Save Data from the NetMeter to a File
In order to save the data inside the NetMeter to a file:
- Select the desired Interval and Range for the data using the "Data filter" options
- Right click on datalog.json and "Save As" a file to your hard drive. The datalog.json type file can be used later for the "Display a previously saved file" option.
- Right click on datalog.csv and "Save As" a file to your hard drive. The datalog.csv type file can be used for spreadsheet programs such as Excel.
What file format should I choose to save the data?
- Choose the JSON format (datalog.json) to be able to view your file using the interactive plotter functionality built into the NetMeter or available through the online datalog plotting utility.
- Choose the CSV (comma separated values) format (datalog.csv) to be able to use the data with Microsoft Excel.
- For the greatest flexibility, save both formats!
- Use the NetMeter Datalog Archive utility to make data download even simpler
Using the CSV Format with Excel
The comma separated values format contains the following information:
- "model": the NetMeter model number that generated the file
- "mac": the unique serial number of the NetMeter that generated the file
- "label": the label as defined in the sensor setup page
- "desc": the description as defined in the sensor setup page
- "ybase": the base year for time values (0:00 of January 1, 2010)
- "logperiod": interval between datalog entries
- The line after "rdptr" contains the parameter names starting with "time"
- The next line contains the units for each parameter
- The next line contains the scale factor for each parameter
- All remaining lines contain the data for each parameter (each line contains each parameter for the specified time)
Time Format with Excel
The time units used by the NetMeter are the number of seconds since "ybase" (0:00 of January 1, 2010). In Excel, the serial number 1 represents 1/1/1900 12:00:00 a.m. Times are stored as decimal numbers between .0 and .99999, where .0 is 00:00:00 and .99999 is 23:59:59.
To convert NetMeter time for Excel, the formula is:
ExcelTime = NetMeterTime/86400+40179
Plot Data from a File
Use the "Choose File" button to select and load a previously saved file. The file must have been saved previously using the JSON format.
Plot a Data File Without a NetMeter
Step 2: Select the Parameters to Plot
Once data has been loaded either from the NetMeter directly, or from a file, the options for the 2nd step become available:
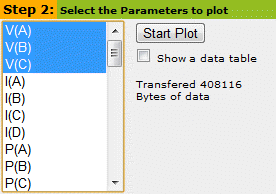
The list of available data items for display is shown in a list widget. Select a parameter to plot by clicking on it, or select multiple parameters to plot by holding the "Ctrl" or "Shift" keys on your keyboard while you click with the mouse.
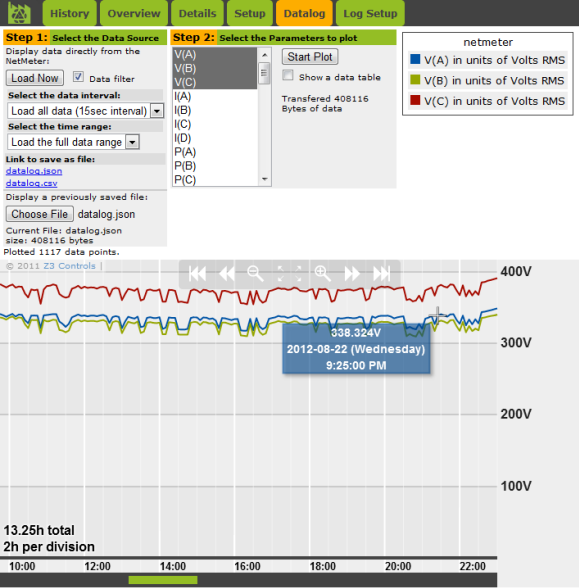
The plot may be interactively zoomed by clicking and dragging on it, or by using the zoom/pan icons at the top of the graph area.
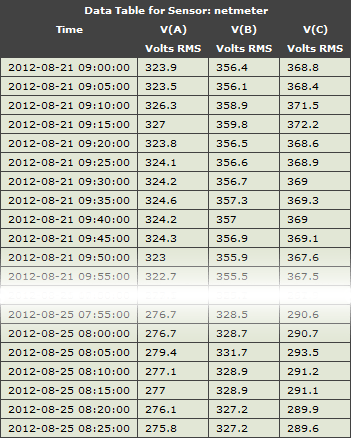
Data Table Option
The "Show a data table" checkbox option will cause a data table to be displayed below the chart.