Introduction
The NetMeter-OMNI may be customized using either widgets or the Application Programming Interface (API).
Widgets:
- Widgets are used to create custom dashboards to display real-time data in a variety of pre-configured formats.
- Widgets are HTML code objects that reside in the NetMeter-OMNI and can be used to embed in other web pages or be used as a custom home page in the NetMeter-OMNI.
- Multiple widgets from either a single NetMeter-OMNI or multiple NetMeter-OMNI's may be used on a custom Homepage allowing data from multiple NetMeter-OMNIs to be visually aggregated.
- Depending on how the widgets are used, they require either no knowledge of HTML or basic understanding of HTML.
API:
- The API is intended for technical users to access data directly from the NetMeter-OMNI. By allowing users to access the raw data directly from the NetMeter-OMNI, the flexibility to process and analyze the data is only limited by the imagination of the user.
API
The API is detailed in the following documents:
| User Guides | ||||
|---|---|---|---|---|
| Title | Type | Size | Date | Note |
| NetMeter-OMNI API Specification 1.0.0 |  |
1023.9KB | 2014-03-22 | TLA |
| NetMeter-OMNI Data Push API Guide 1.0.3 | |
1.1MB | 2014-12-16 | TLA |
There are 2 HTTP/HTTPS API types in addition to the Modbus/TCP API:
- The standard data "Pull" API: this is used by a computer to access the NetMeter-OMNI by requesting data from it. In this model, the NetMeter-OMNI is a "server" and the device accessing it is the "client". The web interface built-in to the NetMeter-OMNI uses this API. The API document also describes methods to incorporate NetMeter-OMNI data into Excel documents.
- The Data Push API: for this API, the NetMeter-OMNI initiates data transfer (as a "client") to a remote server.
- Modbus is another type of API supported by the NetMeter. See the Modbus page for information.
Widgets
Widgets are HTML code objects that display various information and can be parameterized to suit the needs of the user. Parameters are set using a "query string": a standard method defined by the W3C (World Wide Web Consortium).
A query string is the part of a URL that follows the "?" character. It is a list of query terms separated by the "&" character. Here is an example of a URL containing a query string:
http://omni/ilog.html?list=[2,3],[4]&auto=1&nav=0&tspan=10h
In this example http://omni/ilog.html is the base of the URL and ?list=[2,3],[4]&auto=1&nav=0&tspan=10h is the query string. The fields list, auto, nav, and tspan are all parameters that are set to the value after the following = character.
Widget:ilog.html
The widget ilog.html Is designed to pull data from the data loggers and display it graphically.
ilog.html takes the following arguments:
- "h" sets the widget height. If not specified, it will use the dimension of the container window.
- "w" sets the widget width. If not specified, it will use the dimension of the container window.
- "auto" determines if the widget will be automatically updated in real time as new data becomes available. Automatic real-time updating can always be enabled/disabled interactively by the user. The auto setting will determine how it is configured when it is first loaded.
- "auto=0" automatic real-time update is disabled (default)
- "auto=1" automatic real-time update is enabled
- "tspan" determines the time span for the mode "m=f1h"
- "tspan=xs" where x is a numeric value in seconds
- "tspan=xm" where x is a numeric value in minutes
- "tspan=xh" where x is a numeric value in hours
- "tspan=xd" where x is a numeric value in days
- "tspan=xw" where x is a numeric value in weeks
- "mode" determines what data mode will be used. The value of "mode" is used to set the mode for the data query as defined in the API (see the API documentation for more information). The options are:
- "mode=ml" to select the main datalog (default)
- "mode=mlc" to select the coarse data from the main datalog (useful for long time spans)
- "mode=ramlog" to select data from the RAM based datalog (5 minutes at 1s resolution)
- "list" determines what data items will be plotted:
- The list can be a single dimension array such as "list=1,2,3,4,5,6,7,8" or "list=[1,2,3,4,5,6,7,8]" which would plot all 8 channels on a single Y axis. The numerical values in the list are the indices into the data array from the datalog query. Consequently, 0 is not used because index 0 is the time value and data starts at index 1. (see the API documentation)
- The list can also define multiple Y axis regions using an array of arrays such as "list=[1,2,3,4],[5,6,7,8]" (this will plot the first 4 signals on the upper Y axis region and the second set of signals below in a second Y axis region)
- "range" sets the minimum and maximum Y value of plot regions (requires firmware build 0405 or higher):
- The range parameter is a comma separated list of minimum:maximum values with one minimum:maximum value pair per plot region. When a range is not specified, the plot is autoscaled so that it adjusts to whatever data is being plotted.
- For example a range may be specified for a list with 2 plot regions such as: "list=[1,2,3,4],[5,6,7,8]". The following range will set the Y range of the upper plot to 0 to 20 and the range of the lower plot to -500 to 1000: "range=0:20,-500:1000".
- Note that if the data exceeds the specified range, then the autoscale feature will be activated.
- "nav"
is used to enable/disable the navigation bar (menu) at the top of the screen
- "nav=0": the navigation feature is disabled (default)
- "nav=1": the navigation feature is enabled
- "yaxiswidth" can be used to overide the default width of the y axis. A minimum value of 80 is recomended.
- Example: "yaxiswidth=120": sets the width of the y axis to 120 pixels
- "numeric" is used to include a large numeric readout for each channel to the right of the graph. The value assigned to numeric is the pixel width of the numeric portion of the display:
- "numeric=200" will enable the numeric display at a width of 200 pixels. The value for numeric should be much less than the "w" parameter.
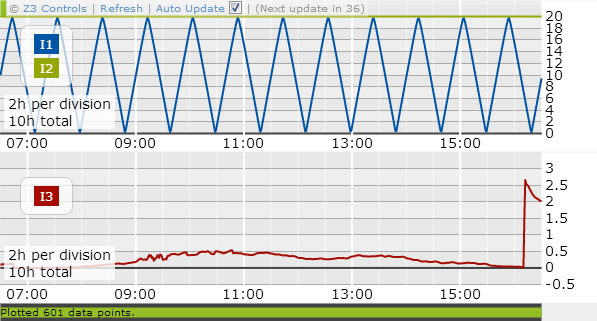
Example of ilog.html (http://omni/ilog.html?list=[2,3],[4]&auto=1&nav=0&tspan=10h)
Using iframes to Embed the Web Widgets Inside Other Web Pages
Web widgets are typically embedded into other web pages using the "iframe" HTML tag.
This example shows the istat.html widget:
Try adding this code to a test page on your own web site and change the "src" address to point to your own NetMeter-OMNI.
To resize the widget, make sure that the iframe width/height matches the w/h of the http query in "src".