NOTE: This feature was added in Firmware V1 Build:0673. You will require a firmware update if this feature is not available in your NetMeter-3P-600 device.
Introduction
Report
The Report tab allows data from a single or multiple NetMeter-3P devices to be displayed and aggregated.
The Report function is useful for making energy calculations. For example: how much energy was consumed across a range of NetMeters and over a specific time period.
Use
The Reports function uses the supplied list of NetMeter-3P-600 devices, captures their data, and displays it in various formats.
List of NetMeters to Scan
In the box "List of NetMeters to Scan", type in a list of NetMeter devices. Either their IP address or NetBIOS name (the name used to refer to them when you view their user interface). Do not include "http://" as part of the name/IP.
Separate each entry in the list with a space.
Optionally, place minus sign in front of an name/IP to subtract it from the total.
Enter "local" to indicate the NetMeter that is running the report.
Example valid list:
| local netmeter1 -192.168.1.85 |
Example Non-valid list:
| local-netmeter1 http://192.168.1.85 |
- "local-netmeter1" is not the same as "local -netmeter1" (space added). "local-netmeter1" will be treated as the netname of a single NetMeter which may not be the intention.
- Do not include http:// in front of an IP address like 192.168.1.85
Load Data
Pressing Load Data will initiate data transfer from all listed NetMeter-3P devices.
A progress indicator will open up and show the status of each NetMeter download.
A red graphic ![]() indicates a communication error. For example, the netname/IP address is wrong or not accessible from your browser.
indicates a communication error. For example, the netname/IP address is wrong or not accessible from your browser.
Once the data has loaded, a table will be displayed at the bottom of the screen.
Data Display
After data has been loaded, there are some options about how it may be displayed.
Auto Update/Update Display
Check the Auto Update box so that any changes in the display options will be immediately updated. Otherwise, press the Update Display button to re-draw the data.
Show Cumulative
By default, the chart shows kWh per day. When "Show Cumulative" is selected, cumulative data is displayed.
In "Show Cumulative" mode, the chart is interactive and clicking on a specific day will make that the zero day. Days after the zero day will accumulate upwards and days before zero day will accumulate downwards.
Calculating Energy for a Specific Time Period
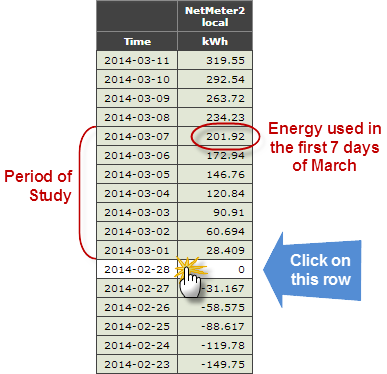
With "Show Cumulative" selected, click on the row with the date of the day before the first day of the time period you want to study. Then, read off the energy/cost values at the end day of for the period of interest: this is the total energy used in the period of interest.
Example: How much energy was consumed for the first 7 days of March 2014?
- In "Show Cumulative" mode, click on 2014-02-28 to make that the zero reference
- Read the cumulative energy for 2014-03-07: that is the total energy used for the first 7 days of March
Ascending Order
By default, the chart is in descending order so that the most recent data is displayed first. Check "Ascending Order" to show the most recent data last.
Show Cost
This option may be used to calculate cost based on the price per kWh programmed into the Sensor Configuration. It applies a simple cost multiplier without any TOU adjustment.
Permanent Link
Once you have a chart presenting the data the way you desire, you can use the "Permanent Link" to recall the report format. Each time you reload the link, it will regenerate the chart with the latest data.