Introduction
The NetMeter may be customized using either widgets or the Application Programming Interface (API).
Widgets:
- Widgets are used to create custom dashboards to display real-time data in a variety of preconfigured formats.
- Widgets are HTML code objects that reside in the NetMeter and can be used to embed in other webpages or be used as a custom home page in the NetMeter.
- Multiple widgets from either a single NetMeter or multiple NetMeter's may be used on a custom homepage allowing data from multiple NetMeters to be visually aggregated.
- Depending on how the widgets are used, they require either no knowledge of HTML or basic understanding of HTML.
API:
- The API is intended for technical users to access data directly from the NetMeter. By allowing users to access the raw data directly from the NetMeter, the flexibility to process and analyze the data is only limited by the imagination of the user.
API
The API is detailed in the following document:
| User Guides | ||||
|---|---|---|---|---|
| Title | Type | Size | Date | Note |
| NetMeter-3P Web API Specification |  |
690.1KB | 2012-05-02 | TLA |
Widgets
Widget:iframe.html
The widget iframe.html provides a simple graph of power consumption. It takes the following arguments:
- "h" sets the widget height. If not specified, it will use the dimension of the browser window.
- "w" sets the widget width. If not specified, it will use the dimension of the browser window.
- "m" sets the plot mode. Available modes are:
- "m=f0" for last 1 minute at 1 second resolution data
- "m=f0a" for last 2 hours at 1 minute resolution data
- "m=f0b" for last 2 days
Widget:istat.html
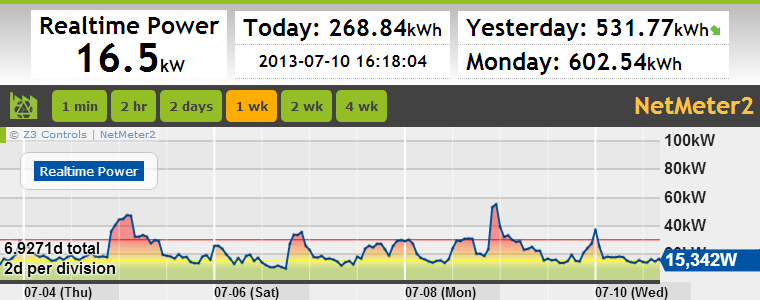
The widget istat.html provides both a statistics window and a real-time power graph. A selector is provided to allow the time scale to be dynamically chosen.
istat.html takes the following arguments:
- "h" sets the widget height. If not specified, it will use the dimension of the browser window.
- "w" sets the widget width. If not specified, it will use the dimension of the browser window.
- "nav" determines if the standard navigation bar is to be displayed at the top of the widget
- "nav=0" turns off the navigation bar
- "nav=1" turns on the navigation bar (default)
- "stat" determines if the top status display is enabled. When enabled, numerical data for power demand and daily/weekly energy use and trending arrows are shown above the data plot.
- "stat=0" turns off the status display
- "stat=1" turns on the status display (default)
- "m" sets the plot mode. Available modes are:
- "m=f0" for last 1 minute at 1 second resolution data (default)
- "m=f0a" for last 2 hours at 1 minute resolution data
- "m=f0b" for last 2 days
- "m=f1h" for hourly data with a time span determined by the "tspan" argument
- "tspan" determines the time span for the mode "m=f1h"
- "tspan=xh" where x is a numeric value in hours
- "tspan=xd" where x is a numeric value in days
- "tspan=xw" where x is a numeric value in weeks
- "poll" determines how frequently the realtime statistics are polled.
- "poll=x" where x is a numeric value in seconds between polling events
Example of istat.html (http://netmeter/istat.html?m=f1h&tspan=1w&h=300&w=760&nav=0)
Widget:ilog.html
The widget ilog.html Is designed to pull data from the advanced data logger and display it graphically.
ilog.html takes the following arguments:
- "h" sets the widget height. If not specified, it will use the dimension of the browser window or enclosing iframe.
- "w" sets the widget width. If not specified, it will use the dimension of the browser window or enclosing iframe.
- "auto" determines if the plot is to be updated in real-time
- "auto=0" the plot will remain static (default)
- "auto=1" the plot will update in real-time as new data becomes available
- "nav" determines if the standard navigation bar is to be displayed at the top of the widget (added in Build 0734, may require firmware update)
- "nav=0" turns off the navigation bar
- "nav=1" turns on the navigation bar (default)
- "tspan" determines the time span for the plot
- "tspan=xh" where x is a numeric value in hours
- "tspan=xd" where x is a numeric value in days
- "tspan=xw" where x is a numeric value in weeks
- "list" is a comma separated list of datalog items to plot. The indexing of the list starts at 1. The mapping of signals to the sequential index is determined by the Advanced Datalog Configuration. It is easiest to create the list value for this widget using the interactive Datalog plotting tool under Datalog. When plotting using the interactive tool, a widget link is generated automaticaly based on the current selection of signals.
Here are some examples of using the list parameter:- "list=1" plots only the first signal in the list
- "list=3,2,1" plots the first 3 datalog signals in reverse order
Example of ilog.html (http://netmeter/ilog.html?tspan=24h&list=11&h=200&w=740&auto=0)

Widget:dash.html
The widget dash.html combines data from multiple NetMeters onto a single screen and adds up the energy.
Note that this widget has been updated in recent firmware (2014-03-03). Make sure you have the most up-to-date firmware to use this widget as described.
ilog.html takes the following arguments:
- "h" sets the widget height. If not specified, it will use the dimension of the browser window.
- "w" sets the widget width. If not specified, it will use the dimension of the browser window.
- "auto" determines if the widget will be automatically updated in real time as new data becomes available. Automatic real-time updating can always be enabled/disabled interactively by the user. The auto setting will determine how it is configured when it is first loaded.
- "auto=0" automatic realtime update is disabled (default)
- "auto=1" automatic realtime update is enabled
- "list" is a list of NetMeters separated by commas.
- These are the NetMeters that will be summed up. Either the IP address
- If no list is supplied, then the list of NetMeters will be taken from the setting in the Dashboard Setup section of the Setup
 Network Configuration
 - If the Dashboard Setup is undefined and no list is specified, then only the local NetMeter will be displayed
- "istat" determines if istat.html widgets (as defined above) will be displayed at the bottom of the screen after the spreadsheet table
- "istat=0" no istat.html widgets are added to the page (default)
- "istat=1" an istat.html widget is added to the page for each NetMeter in the list
Using iframes to Embed the Web Widgets Inside Other Web Pages
Web widgets are typically embedded into other web pages using the "iframe" HTML tag.
This example shows the istat.html widget:
Try adding this code to a test page on your own web site and change the "src" address to point to your own NetMeter.
To resize the widget, make sure that the iframe width/height matches the w/h of the http query in "src".