Introduction
This page describes the viewing of numerical data in real-time.
Realtime Instantaneous Data Display
Details
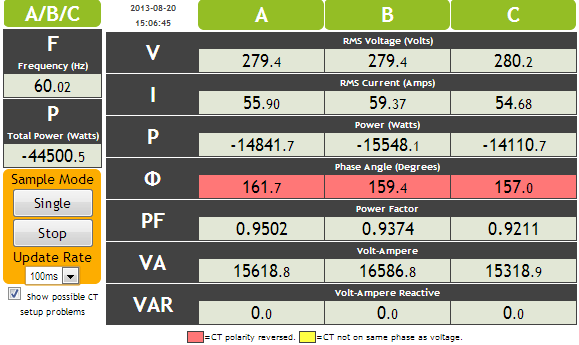
The "Details" displays shows the instantaneous data for all three phases. This display format is useful when setting up the NetMeter-3P in order to ensure that the voltages and CT inputs are connected properly.
Display
The displayed parameters are:
- V: RMS Voltage (Volts) for each phase
- I: RMS Current (Amps) for each phase
- P: Real Power (Watts) for each phase and total. This represents the actual power that is consumed/generated.
- Φ: Phase Angle (Degrees) for each phase. When the phase angle is close to 0°, then the current and voltage are in phase and a favorable power factor will result. If a large phase angle (approaching 180°) is present, then it is likely that the CTs are connected backwards (as in the case of the figure above)
- PF: Power Factor for each phase. the power factor is calculated as the ratio: real power (P) divided by apparent power (VA)
- VA: Volt-Ampere for each phase. This is called "apparent power".
- VAR: Volt-Ampere Reactive for each phase. This is referred to as reactive power, or imaginary power. A high-value for VAR indicates that the load is either capacitive or inductive resulting in the current being out of phase with the voltage.
- F: Line Frequency (based on Phase A voltage)
When the load is switched off (the value of the current is very low) then the phase angle is not meaningful. This will display as fast changing random values for phase angle.
Controls
The update of the data display is controlled by the user using the following controls:
- Single: the single button is used to update the display immediately ( when the display is stopped) or place the display into manual update mode (when the display is in continuous updating mode)
- Stop: the stop button is active when the display is in continuous mode. Pressing the Stop button will cease real-time updates and revert to manual update mode.
- Continuous: the continuous button is active when the display is set for manual update. Pressing the Continuous button will initiate real-time updates.
- Update Rate: the Update Rate is used to throttle the refresh of the display. A longer update value will slow down the refresh rate.
- Show possible CT set up problems: this is used to help the installer ensure that the CTs are properly installed.
Troubleshooting CT Phase/Polarity Errors
The Details page can be used to assist in troubleshooting possible CT phase and polarity errors:
- When the "Show possible CT set up problems" checkbox is enabled, the phase angle display will be color-coded as follows:
- Red indicates the possibility that the CT polarity is reversed. This can be resolved by either reversing the CT itself or reversing the polarity of the wire leads on the NetMeter. Polarity errors result in a phase shift of 180° (+/- some offset due to reactive components of the load). This is represented as the red band in the diagram below.
- Yellow indicates the possibility that the CT is on the wrong phrase with respect to the voltage. For example the CT corresponding to voltage phase A is connected to phase B CT input. This type of error will show a non-reactive load at either +120° or -120° (+/- some offset due to reactive components of the load). This is represented as the yellow bands in the diagram below.
The error indication is visually represented in the diagram below:
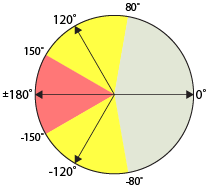
This information will not be reliable under the following conditions:
- If sufficient load current is not available to ensure that the phase angle reading is accurate.
- Highly reactive loads are connected. This will tend to make it difficult to interpret CT phase reversal versus CT phase mismatch.
- If you have both phase reversal and phase mismatch happening at the same time, then this will generate a phase angle of about +/-60°. However, a highly reactive load could also exhibit a similar phase angle.
A phase angle of roughly +/-60° may indicate that the CT is on the wrong phase AND the polarity is inverted.
Generally, the correct phasing and polarity exists for the combination that results in the lowest displayed phase angle. The exception is for loads that are highly reactive.
If the CTs are attached to the correct phase but are inverted in polarity, then the "Enable reverse(negative) energy flow" checkbox in the advanced sensor configuration page can be unchecked. This will effectively cause the NetMeter to ignore the CT polarity and show energy flow in either direction as a positive value.
Realtime Cumulative Energy Display
Details Energy Use
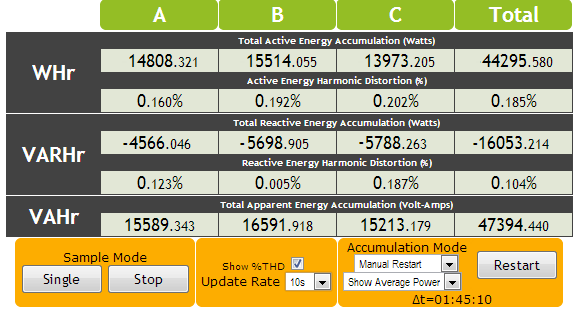
The "Energy Use" display shows real-time numerical data for energy.
Realtime Energy Display
Controls
Accumulation Mode
There are number of ways that the energy information can be shown under the "Accumulation Mode":
- Total Accumulation: displays the total energy since the NetMeter was commissioned
- Manual Restart: displays the total energy since the restart button was pressed. Alternately, it displays the average power since the restart button was pressed. Manual Restart mode can be used to measure the energy used for a specific period of time (Δt is the time period).
- Auto Restart: displays the total energy (or alternately the average power) since the last update. The update rate is controlled through "Update Rate". The data will be more accurate for longer update rates (5s or longer should be used).
Harmonic Distortion: (%THD)
For WHr and VARHr there are two sets of energy measurements:
- Total Energy (including harmonics)
- Fundamental Energy (excluding harmonics)
The checkbox "Show %THD" calculates the total harmonic distortion and displays that as a percentage.
THD is calculated as:
![]()
Update Rate
The Update Rate determines the refresh of the display data.
Sample Mode
The update of the data display is controlled by the user using the following controls:
- Single: the single button is used to update the display immediately ( when the display is stopped) or place the display into manual update mode (when the display is in continuous updating mode)
- Stop: the stop button is active when the display is in continuous mode. Pressing the Stop button will cease real-time updates and revert to manual update mode.
- Continuous: the continuous button is active when the display is set for manual update. Pressing the Continuous button will initiate real-time updates.
Display
The displayed parameters are:
- WHr: Total Active Energy Accumulation. This is the total active (real) energy including all harmonics. It is displayed as either:
- KiloWatt-Hours ("Show Energy" under "Accumulation Mode")
- Watts ("Show Average Power" under "Accumulation Mode"). The Watts are calculated as the energy divided by time (Δenergy/Δt).
- WHr: Active Fundamental Energy Accumulation This is the portion of the active (real) energy that does not contain any harmonics. As above, it is displayed as either KiloWatt-Hours or Watts. The "Show %THD" checkbox much must be unchecked to display this quantity.
- WHr: Active Energy Harmonic Distortion (%). The total harmonic distortion for active (real) energy. The "Show %THD" checkbox much must be checked to display this quantity.
- VARHr: This section of the display is exactly like WHr except for the reactive energy
- VAHr: Total Apparent Energy Accumulation displayed as either KiloVolt-Amp-Hours or Volt-Amps (depending on the setting of "Accumulation Mode": "Show Energy" or "Show Average Power")
- Energy values/THD are shown for all three individual phases and the sum of all three active phases