
Frequently Asked Questions
FAQ
In order to verify that your web browser is compliant, please use the following link: Browser Compatibility Check.
Another useful, but optional, software application is the Z3 Device Discoverer. It allows all Z3 devices to be found on a network. It is available here: Z3 Device Discoverer
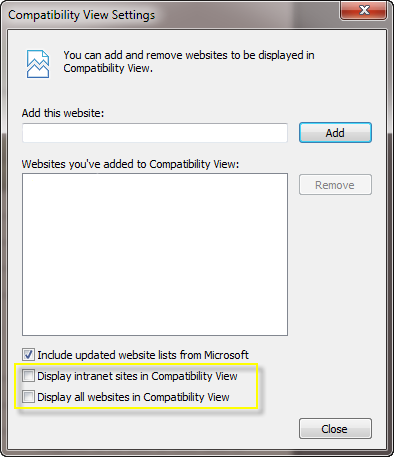
If you have IE9 or above and have display problems or warnings when using it with the NetMeter then you are likely using it in "Compatability View". In this mode, IE acts as if it was an older version and will not render the page as a standards compliant browser should.
To disable compatability mode:
- Uncheck the item "Compatability View" under the "Tools" menu in IE
In the future, IE may revert you back to Compatability View so to fix this in a more perminant way:
- Click on Tools->Compatability View settings to bring up the panel below
- Uncheck "Display intranet sites in Compatability View" and make sure "Display all websites in Compatability View" is also unchecked
The Firefox and Chrome browsers are recommended for best compliance with worldwide web standards. Internet Explorer has traditionally been the least compliant with these standards in favor of Microsoft proprietary methods.
Please visit our Partners page for more information.
The NetMeter is designed to work with CTs that produce a voltage proportional to the primary current. The full scale voltage for the NetMeter is 0.35 VRMS. A common CT configuration is that the CT produce 0.333 VRMS at it's rated current.
CTs that produce a voltage in this way contain a burden resistor. However, some CTs do not contain a burden resistor. These CTs can be used with the NetMeter only when a burden resistor is added.
You can purchase compatible CTs directly from Z3 Controls. A list of available CTs is posted here: List of Available CTs.
For more help using unburdened CTs, an explanation and calculator is available here: CT Calculator.

| Product Briefs | ||||
|---|---|---|---|---|
| Title | Type | Size | Date | Note |
| NetMeter-OMNI-8C Product Brief |  |
2.4MB | 2014-02-02 | |
| User Manuals | ||||
| Title | Type | Size | Date | Note |
| NetMeter-OMNI-8C Installation Manual | |
3.4MB | 2014-02-19 | |
| NetMeter-OMNI-8C Modbus Manual | |
263.7KB | 2013-12-02 | |
| User Guides | ||||
| Title | Type | Size | Date | Note |
| NetMeter-OMNI NEMA1 10"x10" QuickGuide | |
2.7MB | 2014-09-24 | |
| Online Help for the NetMeter-OMNI |  |
- | - | |
| NetMeter-OMNI API Specification 1.0.0 | |
1023.9KB | 2014-03-22 | TLA |
| NetMeter-OMNI Data Push API Guide 1.0.3 | |
1.1MB | 2014-12-16 | TLA |
| Downloads/Firmware | ||||
| Title | Type | Size | Date | Note |
| NetMeter-OMNI Firmware Update: Notes and Instructions | |
- | - | |
| NetMeter-OMNI Firmware Update (V1 Build:0459) |  |
638.5KB | 2016-04-06 | TLA |
| NetMeter-OMNI Firmware Update (V1 Build:0405) | |
638KB | 2014-08-29 | TLA |
| Z3 Device Discoverer 1.00 | |
207.3KB | 2012-08-14 | TLA |
| Z3 Device Discoverer Installation Instructions | |
- | - | |
| Online Tools | ||||
| Title | Type | Size | Date | Note |
| Online Datalog Viewer (view a previously saved JSON file) | |
- | - | |
Direct connection to the NetMeter is described here: Direct Network Connection.
Offline viewing of data from the Datalogger is described here: Datalog Online Help.
The tool for offline viewing is found here: Offline NetMeter Datalog Viewing Tool.
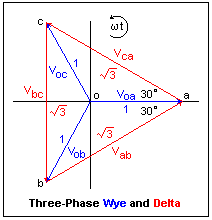
The NetMeter measures the "Wye" (Y) voltage. That is, the voltage between line and ground. However, the rated service voltage is the "Delta" (Δ) voltage (the voltage measured line to line).
The table below shows some typical Delta/Wye voltages. The Wye voltage is calculated as the Delta voltage divided by the square root of 3 (~1.732). conversely, the delta voltage is calculated as the Wye voltage multiplied by the square root of 3.
| Delta Voltage | Wye Voltage |
|---|---|
| 600V | 347V |
| 575V | 332V |
| 480V | 277V |
| 240V | 139V |
| 208V | 120V |
For example, a 600V circuit will indicate approximately 347V when measured between neutral and line. That is why a 600V circuit is sometimes referred to as a 600V/347V circuit.
The square root of 3 factor is derived by solving the following geometric problem using trigonometry:
Cumulative energy (watt hours) is measured by the NetMeter by sampling the input current and voltage 8000 times per second and continually summing the result. Instantaneous power (watts) is measured by considering only the most recent samples over a fraction of a second.
The NetMeter can store both cumulative energy (watt hours) and instantaneous power in the data logger. When cumulative energy is plotted together with instantaneous power, they will usually look almost the same. That is because the data log plotter will display the cumulative energy as the average power over the sampling interval. This will typically be similar to the instantaneous power.
However, if the load is switching quickly (for example: a heater that cycling fully on/fully off every few seconds) then the instantaneous power (P(A+B+C)) will appear "spiky" compared to the cumulative energy (WHr(A+B+C)) as in the screenshot below:
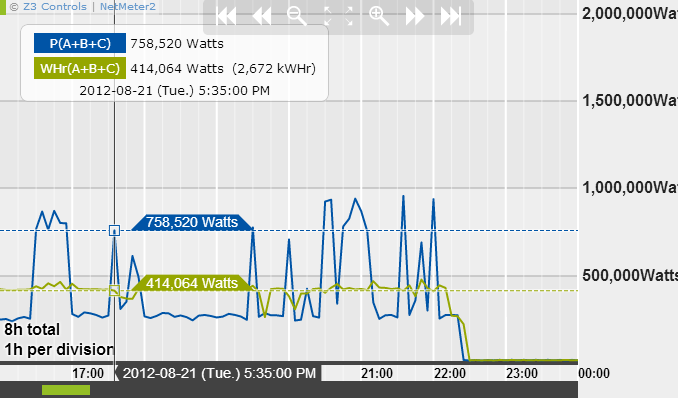
Conclusion: cumulative energy provides a more accurate long-term perspective. Instantaneous power reveals how intermittent the load is.
Peak demand is typically defined as the highest average power of any 15 min. interval. The NetMeter can display the 15 minute average demand (P15(A+B+C)) from the datalogger as in the screenshot below:
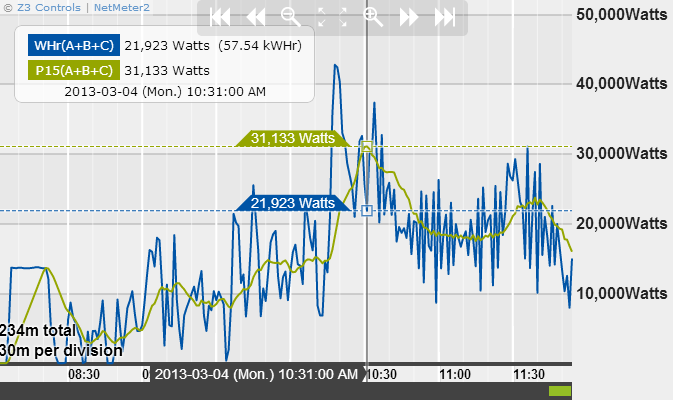
To display P15, it is necessary to enable WHr(A+B+C) in the datalog set up. The P15(A+B+C) is automatically derived from WHr(A+B+C) and is available for plotting in both the interactive datalog plotting utility and the datalog plotting widget.
See the datalog online help for more information on this topic.
Data from the data log can be saved into different formats: JSON and CSV.
- Choose the JSON format (datalog.json) to be able to view your file using the interactive plotter functionality built into the NetMeter or available through the online plotting tool.
- Choose the CSV (comma separated values) format (datalog.csv) to be able to use the data with Microsoft Excel.
- For the greatest flexibility, save both formats!
For more information, consult the Advanced Datalog Online Help
Graphs created by the NetMeter may be captured to a file and/or pasted into a document using a variety of available screen capture utilities.
Windows 7 has a built-in tool called "Snipping Tool" that may be used for this purpose. To open Snipping Tool:
- Click the Start button
- Click All Programs
- Click Accessories
- and then click Snipping Tool
Further details are available on the Microsoft website: Snipping Tool
Other free screen capture programs: Screenshot Captor, DuckCapture, SnapDraw. Search online for reviews and alternatives.
In many three-phase applications, the neutral wire is not available. Simply do not connect this terminal on the NetMeter.
While neutral is optional, ground should always be connected.
![]()
Compatibility
Browser Compatibility
Z3 products are compatible with all major modern web browsers including:
- Firefox
- Internet Explorer (Version 9 or above)
- Google Chrome
- Opera
- Safari
Follow this link to test your browser for compatibility: Browser Compatibility Check